
7 min read

If you’re familiar with Google Analytics, you know how powerful this tool is when it comes to measuring website activity. Google’s Universal Analytics has become a staple in our arsenal of tools we use to show how PR efforts are driving prospects through our clients’ sales funnels and contributing to overall business goals. In 2020, Google rolled out the newest version of the platform called Google Analytics 4 (GA4), which promises to yield better reporting by using machine learning insights all while prioritizing user privacy.
This all sounds great, considering we’re moving toward a cookieless future, and marketers need to get used to finding new ways to reach target audiences. But if you’ve kept ignoring the huge countdown clock that pops up on the screen telling you the current Google Analytics property you’re using will stop processing data starting July 1, 2023, it’s time to stop dragging your heels and get on board with GA4.
I’ll admit, when I saw the first iteration of GA4, I was less than thrilled about its measurement capabilities. It seemed like every metric PR teams use to show the ROI behind PR was no longer trackable or impossible to find. Luckily, GA4 continues to roll out new capabilities that have made this tool comparable to Universal Analytics. Here, I’ll show you a few of the metrics we use for PR measurement and reporting.
1. Referral Traffic Breakdown
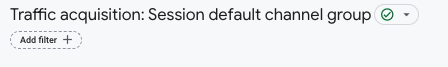
To see if your media coverage is driving web traffic, we used to go directly to the referral traffic report. This report showed a breakdown of sessions from people who came to your domain by clicking on a backlink in an article. Under the traffic acquisition report in GA4, you can see a breakdown of website traffic by session default channel grouping where referral traffic is listed, but now that link isn’t clickable, so you’ll need to apply filters to dig deeper into this data set.
To add a filter, click “Add Filter” under the headline at the top of the report:
Next, the build filter window will pop up on the right side of the screen. Under Include, select the dimension for “Session Default Channel Group.” Under Dimension values, check the box next to “Referral.” Your filter should look like this:
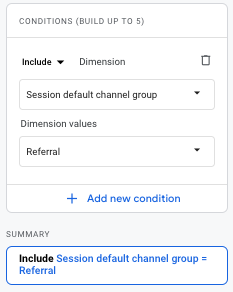
Click apply, and the table will be updated to only show website traffic categorized as referral.
Now that we’ve drilled down to only show referral traffic, let’s dig deeper to see which websites are responsible for driving this traffic. To do this, click the plus (+) sign next to Session default channel group at the top of the table.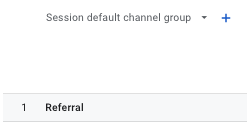
When the pop-out box appears, type in “first user source / medium” in the search bar, and select the option from the list.
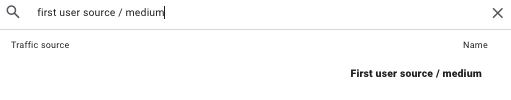
And that’s it! Now you have a table that shows you all the websites driving referral traffic to your site.
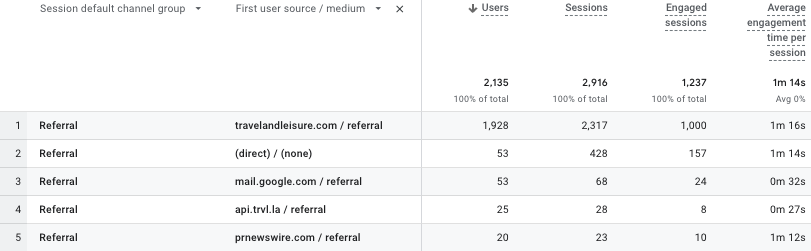
With this information, PR teams can glean valuable insights about media placements they secure for clients, including how many sessions/users they garnered, how long consumers stayed on the website and whether the coverage resulted in any conversions (i.e., sales, whitepaper downloads, etc.) All these insights grouped together are much more valuable than simply telling your client you secured 10 media placements this quarter.
2. Social Media Traffic by Platform
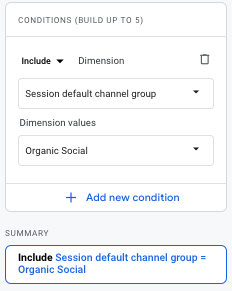
Next up, we have social media traffic by platform. This report is important to show which social platforms are best for reaching our clients’ customers. Similar to the referral traffic example, GA4’s traffic acquisition report doesn’t break down the specific social media channels driving users to the website. Instead, it categorizes all of them under Organic Social. If you want to show the performance of individual social media channels, you’ll need to follow similar steps as the ones in the referral traffic example.
The only difference here is that when you’re building the filter, you’ll check the box next to Organic Social. Your filter should look like this:
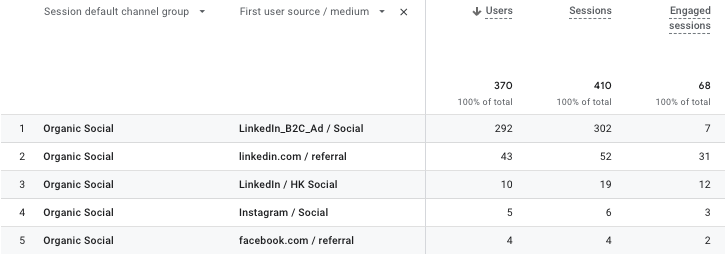
Now, dig deeper into the data by clicking the plus (+) sign to add “first user source / medium” to the table. Now you have a table that shows you all the social platforms driving traffic to your website.
This report is not just valuable for those managing social accounts for clients. A media placement or award win is only as valuable as you make it. If you don’t amplify your company wins across social media channels, you’re missing out on potential customers keeping your business top of mind when they’re in the market for what you’re selling.
3. Top-Performing Blogs
PR teams often look for blogs that are generating the most website traffic and engagement to use in media outreach or for social media content. Previously in Universal Analytics, this was found under the content drilldown report. GA4 provides a report called “pages and screens” that pulls data for the top-performing overall pages, which is useful but doesn’t give us the breakdown of the blog itself.
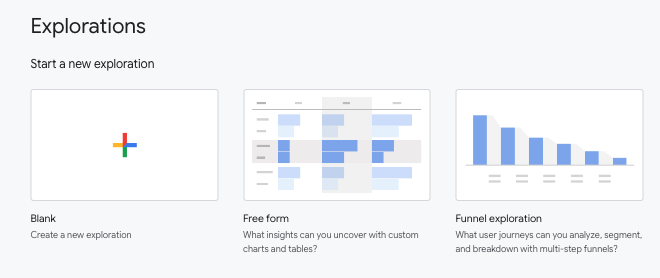
To see the blog traffic breakdown, you’ll need to build a custom report. To do this, navigate to the Explore tab, then start with a free-form report.
This will open the report builder where you can specify the information you want to see, with two columns titled Variables and Tab Settings. Under the Variables column, scroll down to the dimensions section, and click the plus (+) sign to add the dimension for “page path + query string”. Click import.
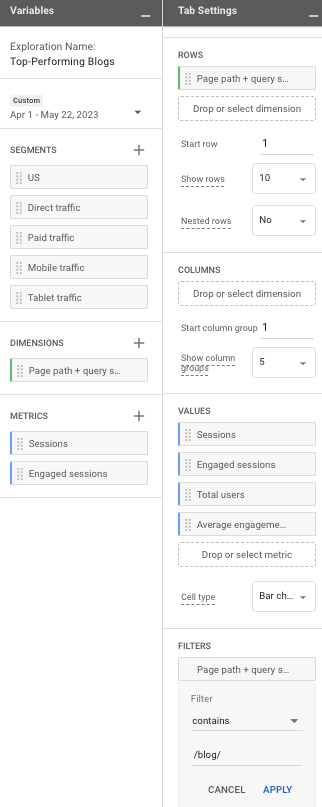 Next, scroll down to the metrics section in the Variables column, and click the plus (+) sign to add the metrics you want to include in your chart. You can choose any metrics you want, but for blog measurement, I recommend sessions, total users, new users and average engagement time per session. Once you’ve selected all of your metrics, click Import.
Now, under the dimensions section in the Variables column, drag the box for “Page path + query string” over to the next column titled Tab Settings and place it under the values section where it says, “Drop or select dimension.”
Under the metrics section in the Variables column, drag the boxes for all the metrics you selected over to the Tab Settings column under Values where it says, “Drop or select dimension.”
Finally, in the Tab Settings column under Filters, click the box that says, “Drop or select dimension or metric,” and click, “Page path + query string”. Select the match type of, “Contains,” and enter “/blog/” in the expression field and click apply.
When you’ve finished filling out the report builder, it should look like the graphic on the right.
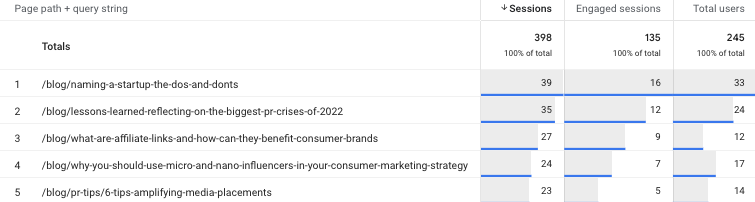
On the right side of the screen, you should now see a table populated with all pages containing /blog/ in the URL, and you can sort it in order by clicking on the metrics at the top of the table. Note: This report will only work for you if your blog URLs contain the query string of /blog/. Modify this language to match how your company website categorizes blogs.
One of the biggest challenges PR professionals face is proving the ROI of PR efforts, so when Google announced sunsetting Universal Analytics, it’s no surprise many of us wondered how this would impact our reporting capabilities. Although GA4’s interface is a bit more confusing than its predecessor, it can still be used to pull powerful information about how users interact with your online content.
GA4 is updated frequently, so I’ll share more information about how these updates affect the above metrics as they become widely available to Google Analytics users. For now, happy analyzing!
Comments