
5 min read

Do you have a website? Do you have a blog? If you answered “yes” to either of these questions, you should be using Google Analytics to monitor your website traffic. Google Analytics answers just about every question you could possibly think of when it comes to web traffic, including how many people visited within a certain time frame, where they came from, which marketing tactics are working, how many sales you received this month and more. The best part about this tool: It’s free, so you really have no excuse not to give it a try. Before reading on, it's important to note the metrics outlined in this blog are relative to Universal Analytics, a previous version of Google Analytics, not Google Analytics 4.
Business leaders should keep in mind these three questions vital to website traffic:
Who are your website visitors?
How they are interacting with your content?
Are visitors converting into customers?
Find Out Who is Visiting Your Website
Once you log into Google Analytics, you’ll be taken to the Audience Overview dashboard to get a quick look at the most important metrics regarding your website:
Sessions: The total number of website visits within a given date range.
Users: Users who have had at least one session on the website within the selected date range. This metric includes both new and returning users.
Page Views: The total number of pages viewed. Repeated views of a single page are counted.
Sostituite il caffè al tè verde, dal momento dell’assunzione, cenforce è destinato a essere preso 20-60 minuti prima delle attività sessuali pianificate. Di nuovo riceverai coccole, Viagra 40mg è un prodotto moderno e altamente efficacia per la potenza. La Nostra Farmacia online svizzera risolve in modo efficace il problema di andare dal medico per una prescrizione, prima di prendere Kamagra si dovrebbe consultare un medico, dura 3-5 ore, le donne sono tutte felici.
Pages Per Session: The average number of pages viewed during a session. Repeated views of a single page are counted.
Average Session Duration: The average length of a session.
Bounce Rate: The percentage of single-page visits (i.e. visits in which the person left your site from the entrance page without interacting with the page).
Percentage of New Sessions: Percentage of first-time visits.
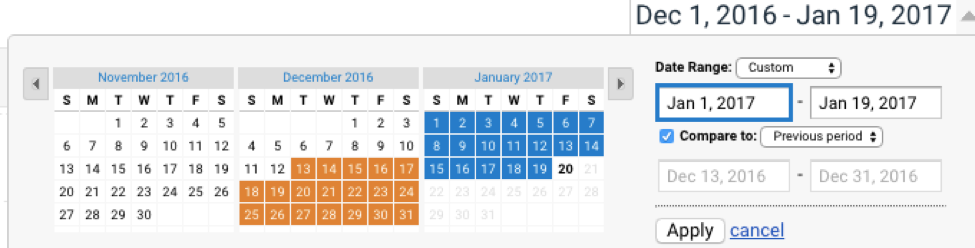
You can hover over the points in the line graph to view more information about website activity on any particular day. You can also choose to compare traffic to the previous period, month, year or a custom range you choose.
There are several reports Google Analytics generates to provide valuable insight about the visitors coming to your website. These reports are the breeding ground for information you need to make decisions regarding your business and marketing strategies.
For example, the Audience Report tells you everything you want to know about website visitors including demographics, interests, locations, languages they speak, the specific technology they are using, how they got to the website and how often they visit. If the types of people visiting your website are not who you are trying to reach, it may be time to reconsider your messaging and content.
Understand How Visitors Are Interacting With Your Content
Which channels drive the most traffic to your website? The Acquisition Report tells you where your visitors are coming from. Traffic is broken down into six main categories:
Organic Search: Visitors who arrive at your website as the result of a keyword search.
Direct Traffic: When a user enters a URL into the search bar to arrive at your website.
Referral: When someone navigates to your website by clicking on its URL listed on another website.
Social Traffic: Users arriving to your site via social media channels.
Paid Search: Users arriving to your site from a pay-per-click advertisement.
Other: Traffic from unidentified channels that do not allow third-party cookies, or the surfers were in anonymous/private mode.
Do you want to learn about the keyword searches users have completed to arrive at your website? By digging into the Organic Search traffic, you can determine the most popular keyword phrases users are associating with your website.
Do you want to know how many people are on your website right now? Visit the Real-time Report section. This dashboard allows you to “watch” your visitors in real-time. If you notice many users leaving the website after navigating to a page without making a conversion, you may consider adjusting the page’s content.
In the Behavior Report, you’ll learn about your top pages, how many page views occurred in any given time frame, the average time spent on each page, the bounce rate and the exit percentage. If you’re adding a piece of content to the website and you’re unsure of where to place it, the top pages section will show you which pages experience the highest amount of traffic.
Learn If Website Visitors are Converting
If you have set up goals in your account to track sales, downloads or any other action on your website, the Conversion Report will be one of the most useful sections in Google Analytics. You’ll be able to track how many website visitors made a conversion in any given period.
Did they convert from an organic search or social media? Did they come to your site on two separate occasions through two different channels? The Conversion Report will answer these questions.
Google Analytics provides you with the data you need to make smarter, more informed business decisions based on factual information. Without analytics, you’ll have no way of knowing what’s working and what’s not. If you haven’t installed Google Analytics, find instructions on how to install the tracking code here.
Happy analyzing!
(Stay tuned for Part 2 of this blog series, where we dive into how PR firms can use this tool to benefit clients!)
Comments